Long Timeframes

I was reading one of the AMA threads on StockTwits a few months ago when I stumbled on an AMA from Zen Trends founder Cody Freedman; read here. His strategy was a simple trend trading strategy such that you follow the trend until it changes and you look at higher timeframes instead of daily. This helps reduce the day to day noise of the stock’s volatility and helps a trader look at the big picture of where the stock is head.
Over the past month I have studied and incorporated his strategy and even copied his chart layout to mimic his strategy. When I looked at past performance on growth stocks, in an uptrend, I was surprised at how well the 20 day moving average played as a pivotal turning point. Below are Cody’s rules and his timeframe for the swing trade is between 1-12 months.


Rules Summary
- Trade with the trend
- Stick to the pattern
- Manager risk
- Reduce emotions & reactions to volatility
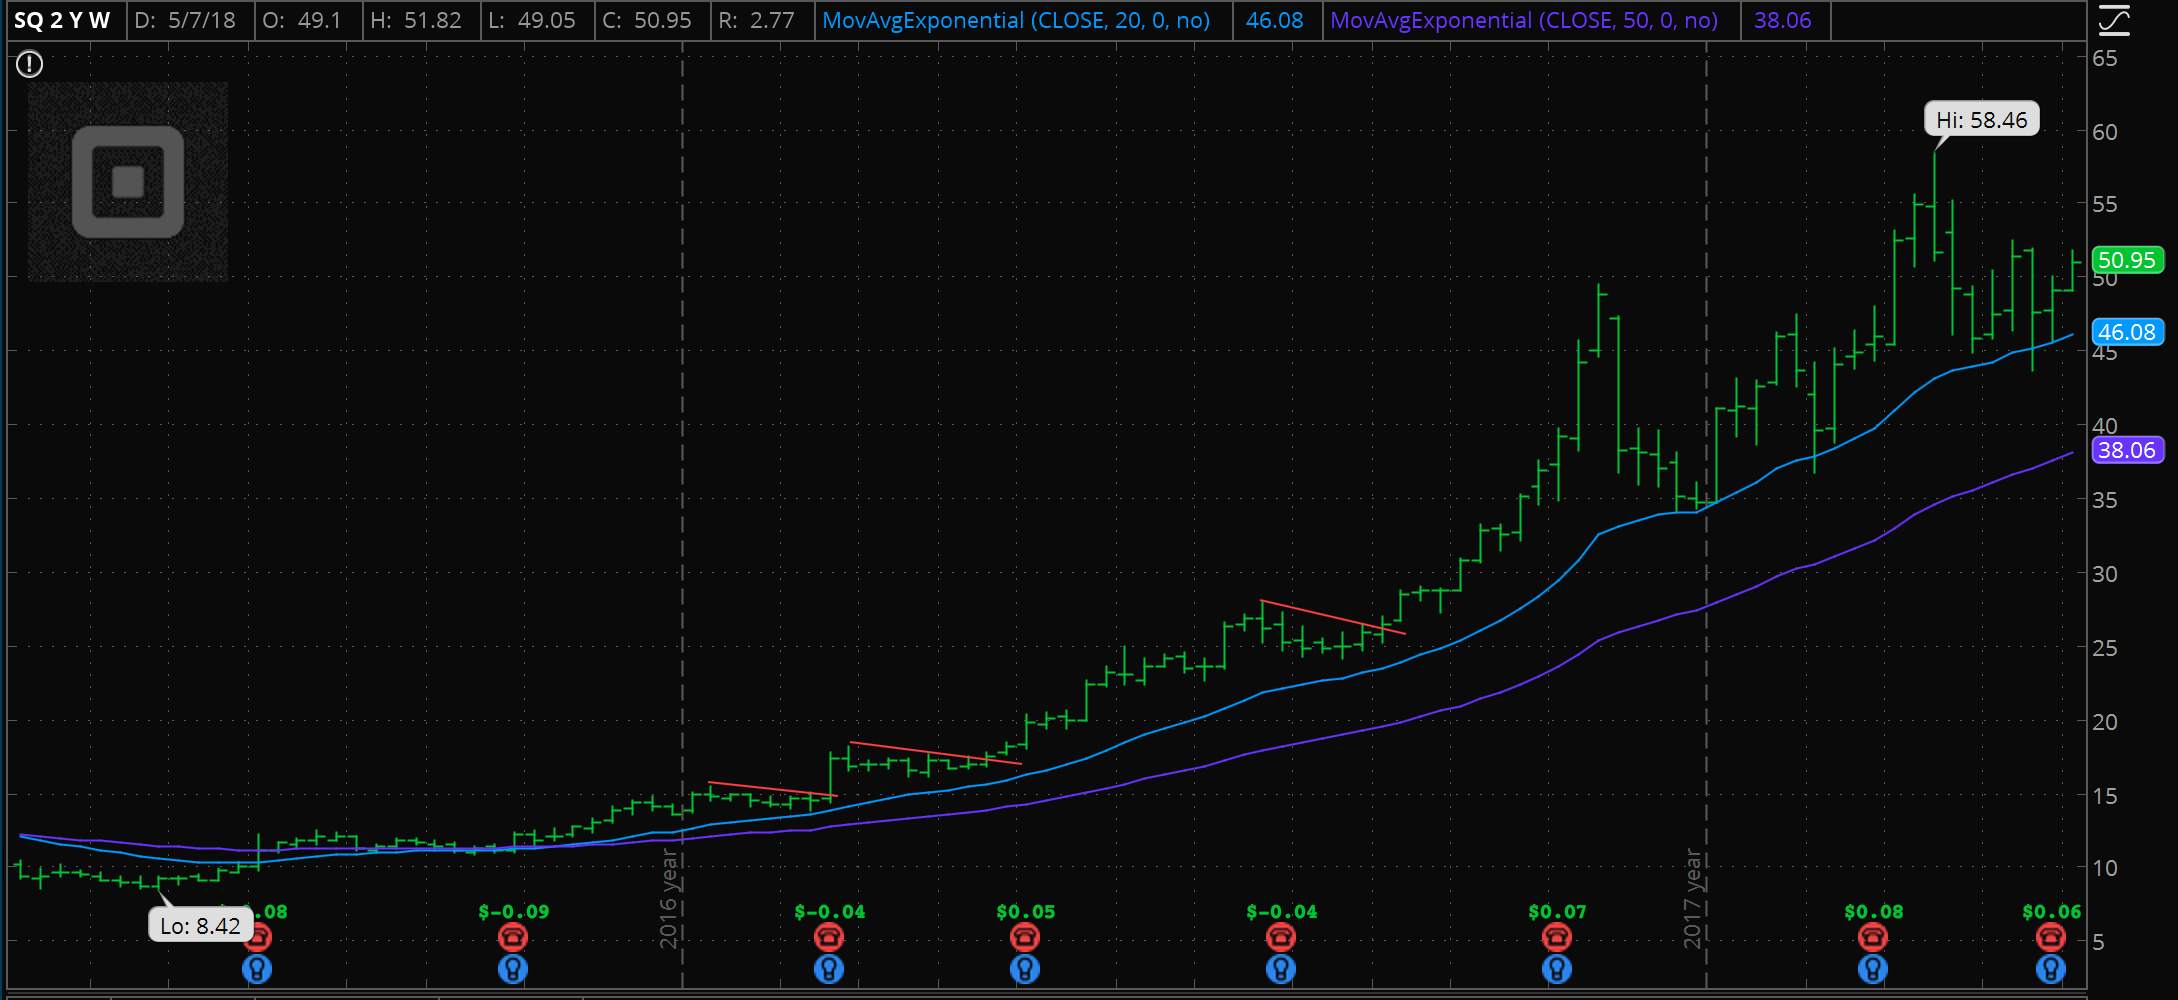
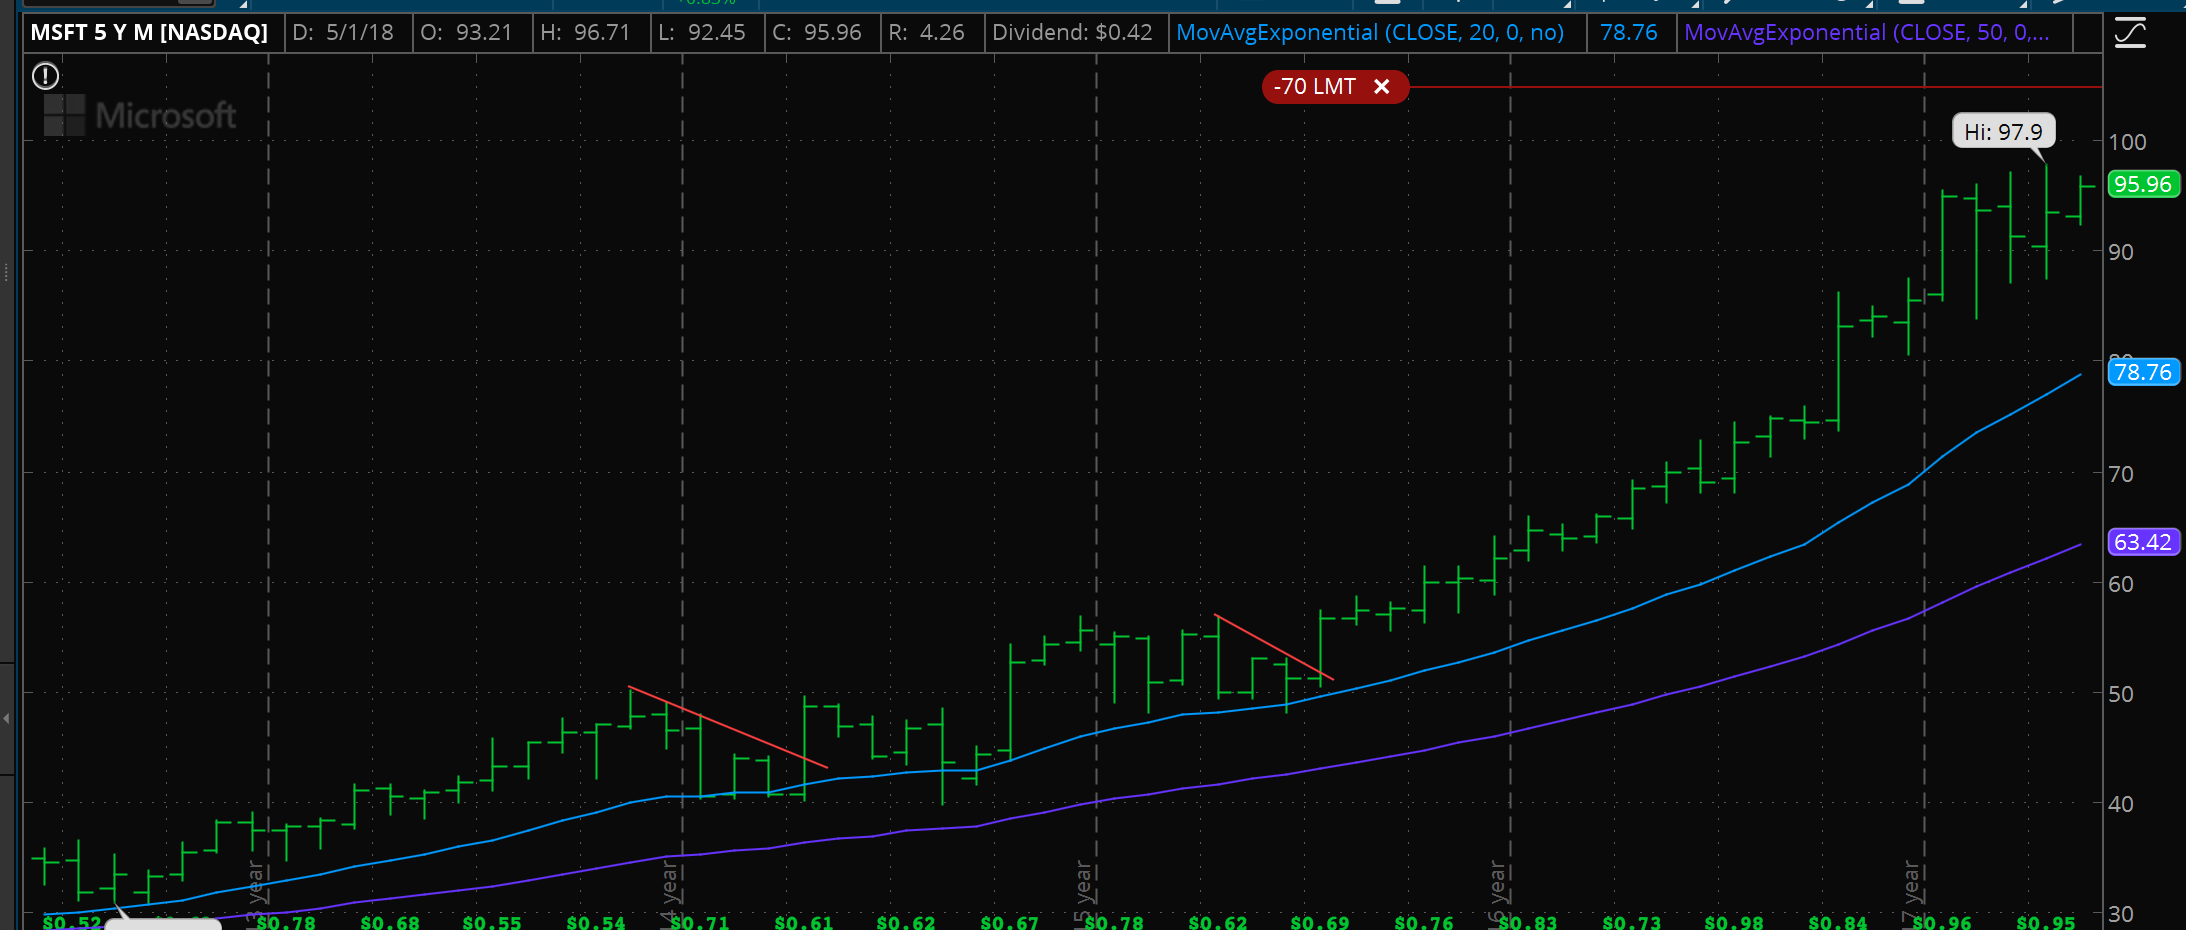
With the rules in place lets look at how he looks for the stocks to play. His strategy has 6 parts. First, he scans for plays to analyze. He starts with the monthly time frame and uses the 20DMA as a guide. Anything above the 20DMA is good and anything below is a no. Even better would be if the 20MA is above the 50MA. The key is to buy after a breakout from tight consolidation. The 20MA needs to be rising also because you want to buy stocks that are trending.
After the initial position has been set he then monitors the weekly time frame and adds to the position after another tight consolidation; usually when price hits 20DMA and breaks downtrend. When price gets away from 20DMA severly that is the time to start taking profits. If the price breaks the 20 and trend has changed that is a strong sell signal. The whole goal is to catch the run right after the breakout.
Cody has several criteria when running his scan. The company must be a growth company with price being above 20DMA on weekly basis. In addition it must be performing stronger than the S&P500. Below is the criteria.
Scan Filters
- US stocks
- Price > 20 weekly average
- Sales 1 year > 0
- Earnings 1 year > 0
- Relative Strength 1 year Vs S&P500 > 0
- Sales growth rate 5 year > 5%
- Price new 50 day high
- Volume > 100,000
- Price > 20 monthly average
Overall this is a great strategy for longer term swing and position plays; one that I will be transitioning to.