CMT Level 1 Notes

The CMT certification stands for Chartered Market Technician. It is like what a CFA is to financial analysis but the CMT is equivalent to technical analysis. As I am studying for the level 1 exam below are my notes for quick reference for the CMT Level 1 Curriculum 2019 by Wiley.
Table of Contents
Theory & History of Technical Analysis
The Basic Principle of Technical Analysis - The Trend
Technical Analysis (TA) is based on one key assumption: Freely traded market prices travel in trends. It is what makes buyers buy a security as well as sell it because of the trend. TAs use charts, moving averages, oscillators, support and resistance etc… to predict movement of price and overall trend.
How Does The Technical Analyst Make Money
- Identify the beginning/end of a trend and jump on it as early as possible to ride the trend.
- Investors must determine 2 key points before a position
- When to take profit (price target)
- When to cut losses if price moves against you (stop loss)
- TAs must calculate their stop loss price to avoid being ruin (heavy losses)
- Three important phrases
- “The trend is your friend” - follow the trend
- Don’t Lose - minimize losses
- Manage Your Money - avoid ruin
What is a Trend
- There are three trends uptrend, down-trend, sideways
- uptrend is when price has higher peaks and troughs
- down-trend is when price has lower peaks and lower troughs
- sideways is when prices fluctuates between a range without any significant upward/downward movement
- TAs definition of a trend is a directional movement of prices that remain in effect long enough to be identified and still profitable
How are Trend Lines Identified
- Linear Least-Squares Regression
- plotting out all the prices and using a best fit line to determine trend
- Trend Lines (preferred)
- plot a point connecting the highest price points and another line connecting the lowest price points in a reasonable time frame.
- these lines are called trend lines and in addition to the trend they can also give us the limits of price points
Trends Develop From Supply and Demand
- When a price moves in a specific direction it is because there are either more sellers or buyers
- Buyer is demand and puts out a bid price
- Seller is supply and puts out an ask price
- TAs believe that using price is the way to determine supply and demand
What Trends Are There
- There are infinite amount of trend lines and can be created at any point in time depending on the investor but they all act similarly over time which is why they are fractal nature
- Period of interest is up to the investor (long, medium, short) but they should always go further out on the time frame to view the overall trend; smaller trends make up larger ones
- Trend Periods
- Primary (months or years)
- Intermediate (weeks or months)
- Short-term (days)
- Intraday (minutes or hours)
What Other Assumptions Do Technical Analysts Make
- Price is determined by interaction of supply and demand
- Price discounts everything so all information known is taken into account at the price
- Markets trend therefore prices are nonrandom
- History repeats itself such that humans will behave similarly to how they have in the past
- Price patterns are fractal just like trend lines
- Emotions are affected by earlier emotions through emotional feedback
Dow Theory
Dow Theory History
- Charles H. Dow is the founder of Dow-Jones & Wall Street Journal
- Father of modern technical analysis and created index to measure overall price movement of U.S. stocks
- He wrote about what would later be called the “Dow Theory” used by A. C Nelson in article called A B C of Stock Speculation
- William Peter Hamilton & Alfred Cowles III continued the work
- Alfred noticed that William’s Dow Theory strategy lagged the market
- Cowles’s study led to the Random Walk Hypothesis (RWH) and Efficient Markets Hypothesis (EMH)
- Robert Rhea in 1932 further expanded on DT and developed 3 hypotheses still used till this day
- The primary trend is inviolate
- short term trends fluctuates but primary trend will always stay intact until broken
- The averages discount everything
- price are result of people acting on the information they know
- Dow Theory is not infallible
- The primary trend is inviolate
Dow Theory Theorems
- market picture consists of an uptrend, top, downtrend, and bottom along with retracements and consolidations
- economic rationale should be used to explain stock market action
- Dow created an industrial average and railroad average
- Industrials represented profits and economic goods being produced
- Railroads represent profits from goods being shipped/delivered into the market
- Both must be in parallel such that if industry is producing goods but railroads are not shipping then industry must slow down.
- Today railroads have been converted to transports and economic activity is measured in the service and technology sectors
- Trends
- Primary trend - broad upward or downward moves that take several years (bull/bear market)
- Bull Market Phases
- reviving confidence from prior primary bear market
- response to increase in corporate earnings
- speculation becomes dominant and prices rise on hopes and expectations
- Bear Market Phases
- abandonment of hopes on stocks
- response to decrease in corporate earnings
- distress selling on people who just want out and feel like more downside is to come
- Bull Market Phases
- Secondary trend - deceptive move in the primary trend that last weeks to months; it is a decline in bull market and rally in bear market
- counters the primary trend and declines between 33% to 66%
- Minor trend - daily movements
- although confusing plotting day to day points eventually creates a recognizable pattern
- Primary trend - broad upward or downward moves that take several years (bull/bear market)
Concept of Confirmation
- Confirmation - in Rhea’s time was consideration of the industrial and railroad averages together.
- if the industrial average makes new high the transports should also make a new high
- Nonconfirmations - divergence between the averages which alerts the TA into a change in trend maybe coming
- if the industrial average fails to make a new high and railroads break trend and go lower
- In today’s world the two indexes used to confirming the overall primary trend is between S&P500 and Russell 2000
- S&P 500 represents economy of the largest companies in the United States
- Russell 2000 represents smaller growth companies and usually with a technology base
Importance of Volume
- High market prices along with less volume on rallies and more activity on declines suggests an overbought market
- Very low prices with dull declines and increased volume on rallies suggest oversold market.
- Price and trend override volume (use as a supplement)
Criticisms of the Dow Theory
- Theory does not recognize a turn until long after it has occurred and confirmed; lags
- although a delay it will prevent large sharp losses
- Different trends are not specifically defined and can make determining the primary trend confusing plus incite investment in wrong direction
History and Construction of Charts
The chart is the traditional tool of a technical analyst. It servers many purposes but overall it tracks price and price movement. Some old school technicians still prefer to draw out the chart by hand as it gives them a feel for the price aciton. Below are some of the important benefits of using a chart
- provide concise price history
- sense of market volatility
- helps investor spot periods of price movements and be able to look at the reasons for the move
- timing tool
- money management tool to pick entry/exit/stop points
- can spot repetitive patterns
- help assist in developing trading systems
- identify key turning points to trend reversals
History of Charting
- Old as Babylonia in first B.C. by recordings/diaries of traders and astronomers who were trying to correlate astrology with price changes
- Fifth & Sixth century A.D. China, Europe, and Japan began to create their own charts
- Japan developed the candlestick which is still used till this day
- First type of chart was just a plot of data on paper used to track price
- Sokyu Honma in 1750s started trading rice
- The ticker tape allowed the gathering of each price traded in a given day
- Modern technology allows us to retrieve and create charts within seconds
- reading price data from an excel sheet will take a lot of time vs just looking at a chart of the data
- chart - a picture is worth a thousand words
What Data Is Needed to Construct a Chart
- Must need clean reliable data
- incorrect trades/prices will throw off the chart
- stock splits, dividends, offerings, distributions, future contracts will also throw off the chart
What Types of Charts Do Analysts Use
- Line Charts
-
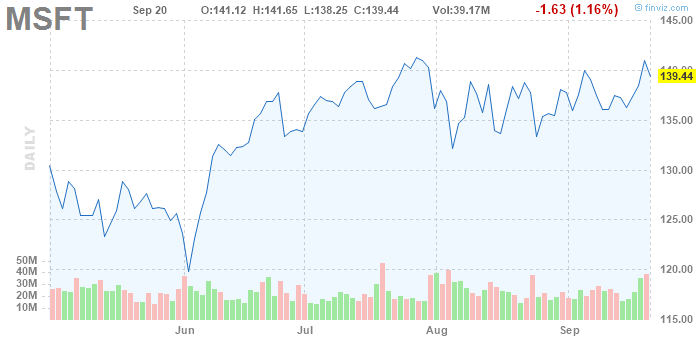
Line Chart - 2 variables price and time
- price data is vertical/y-axis
- time data is horizontal/x-axis (months, years, days, minutes)
- good to study long term trends
- more data creates more noise which can be smoothed out by using longer term timeframes (weekly/monthly)
-
- Bar Charts
-
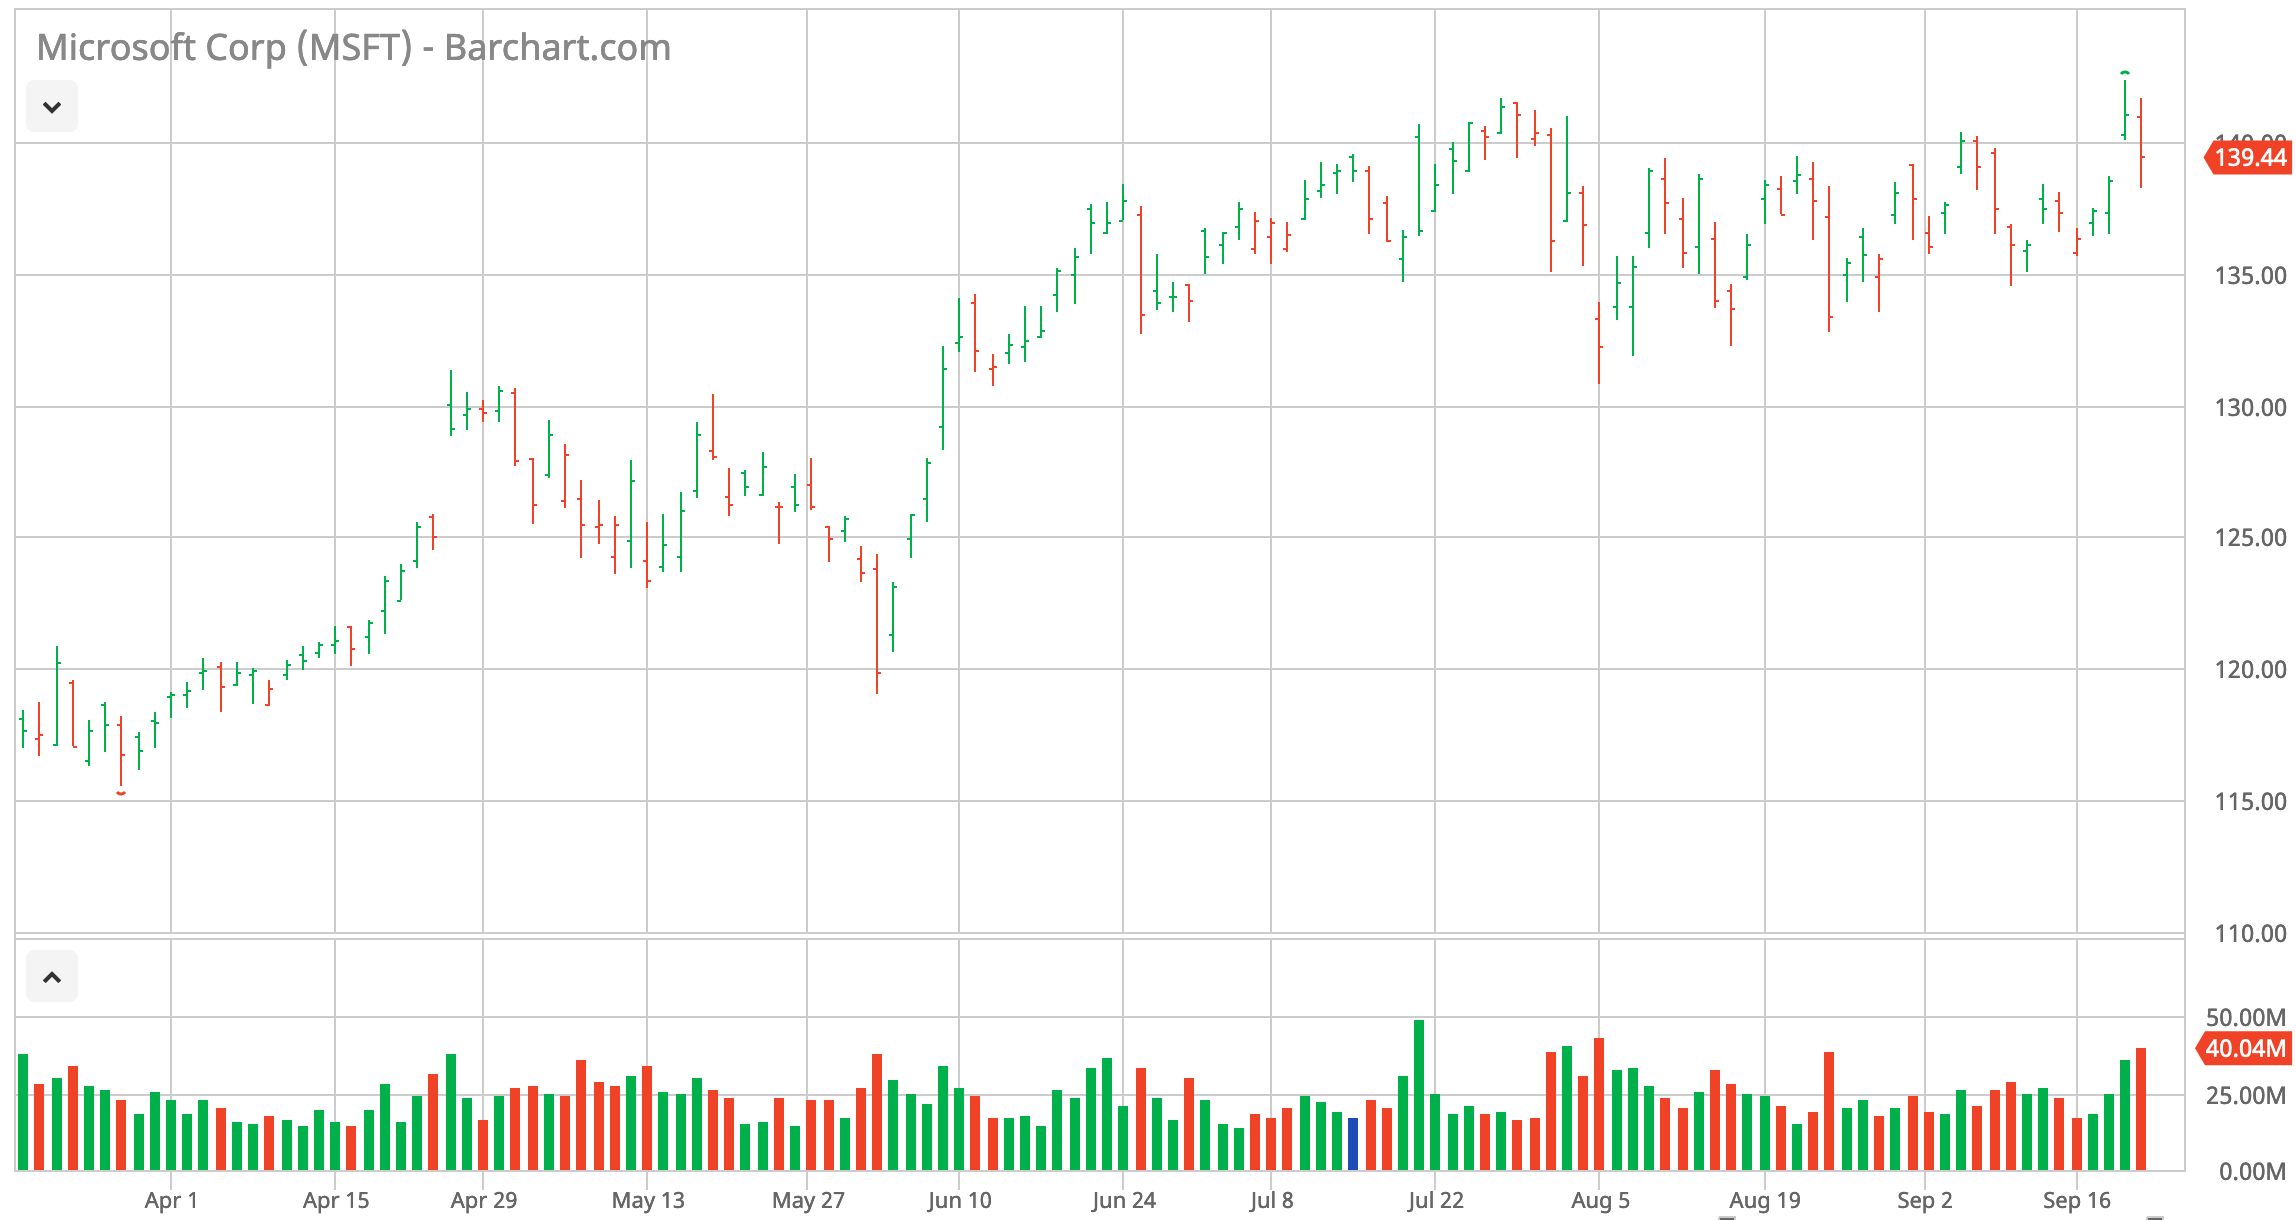
Bar Chart - 3 or 4 variables the high, the low, closing price and opening price
- each time interval is represented by one bar
- the top of the bar shows the highest price traded for the time period
- the bottom of the bar shows the lowest price traded for the time period
- longer the bar the wider the trading range and smaller the bar the tighter the trading range
- small tick on the left is the opening price and small tick to the right represents closing price
- range is the difference between high and low for the time period
- gap is a space on the chart where the two bars do not intersect/overlap
-
- Bar Charts
-
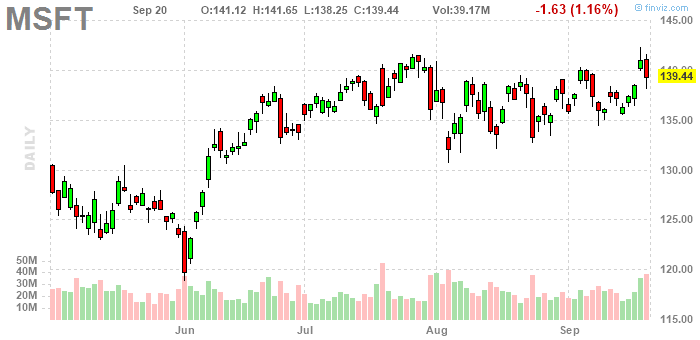
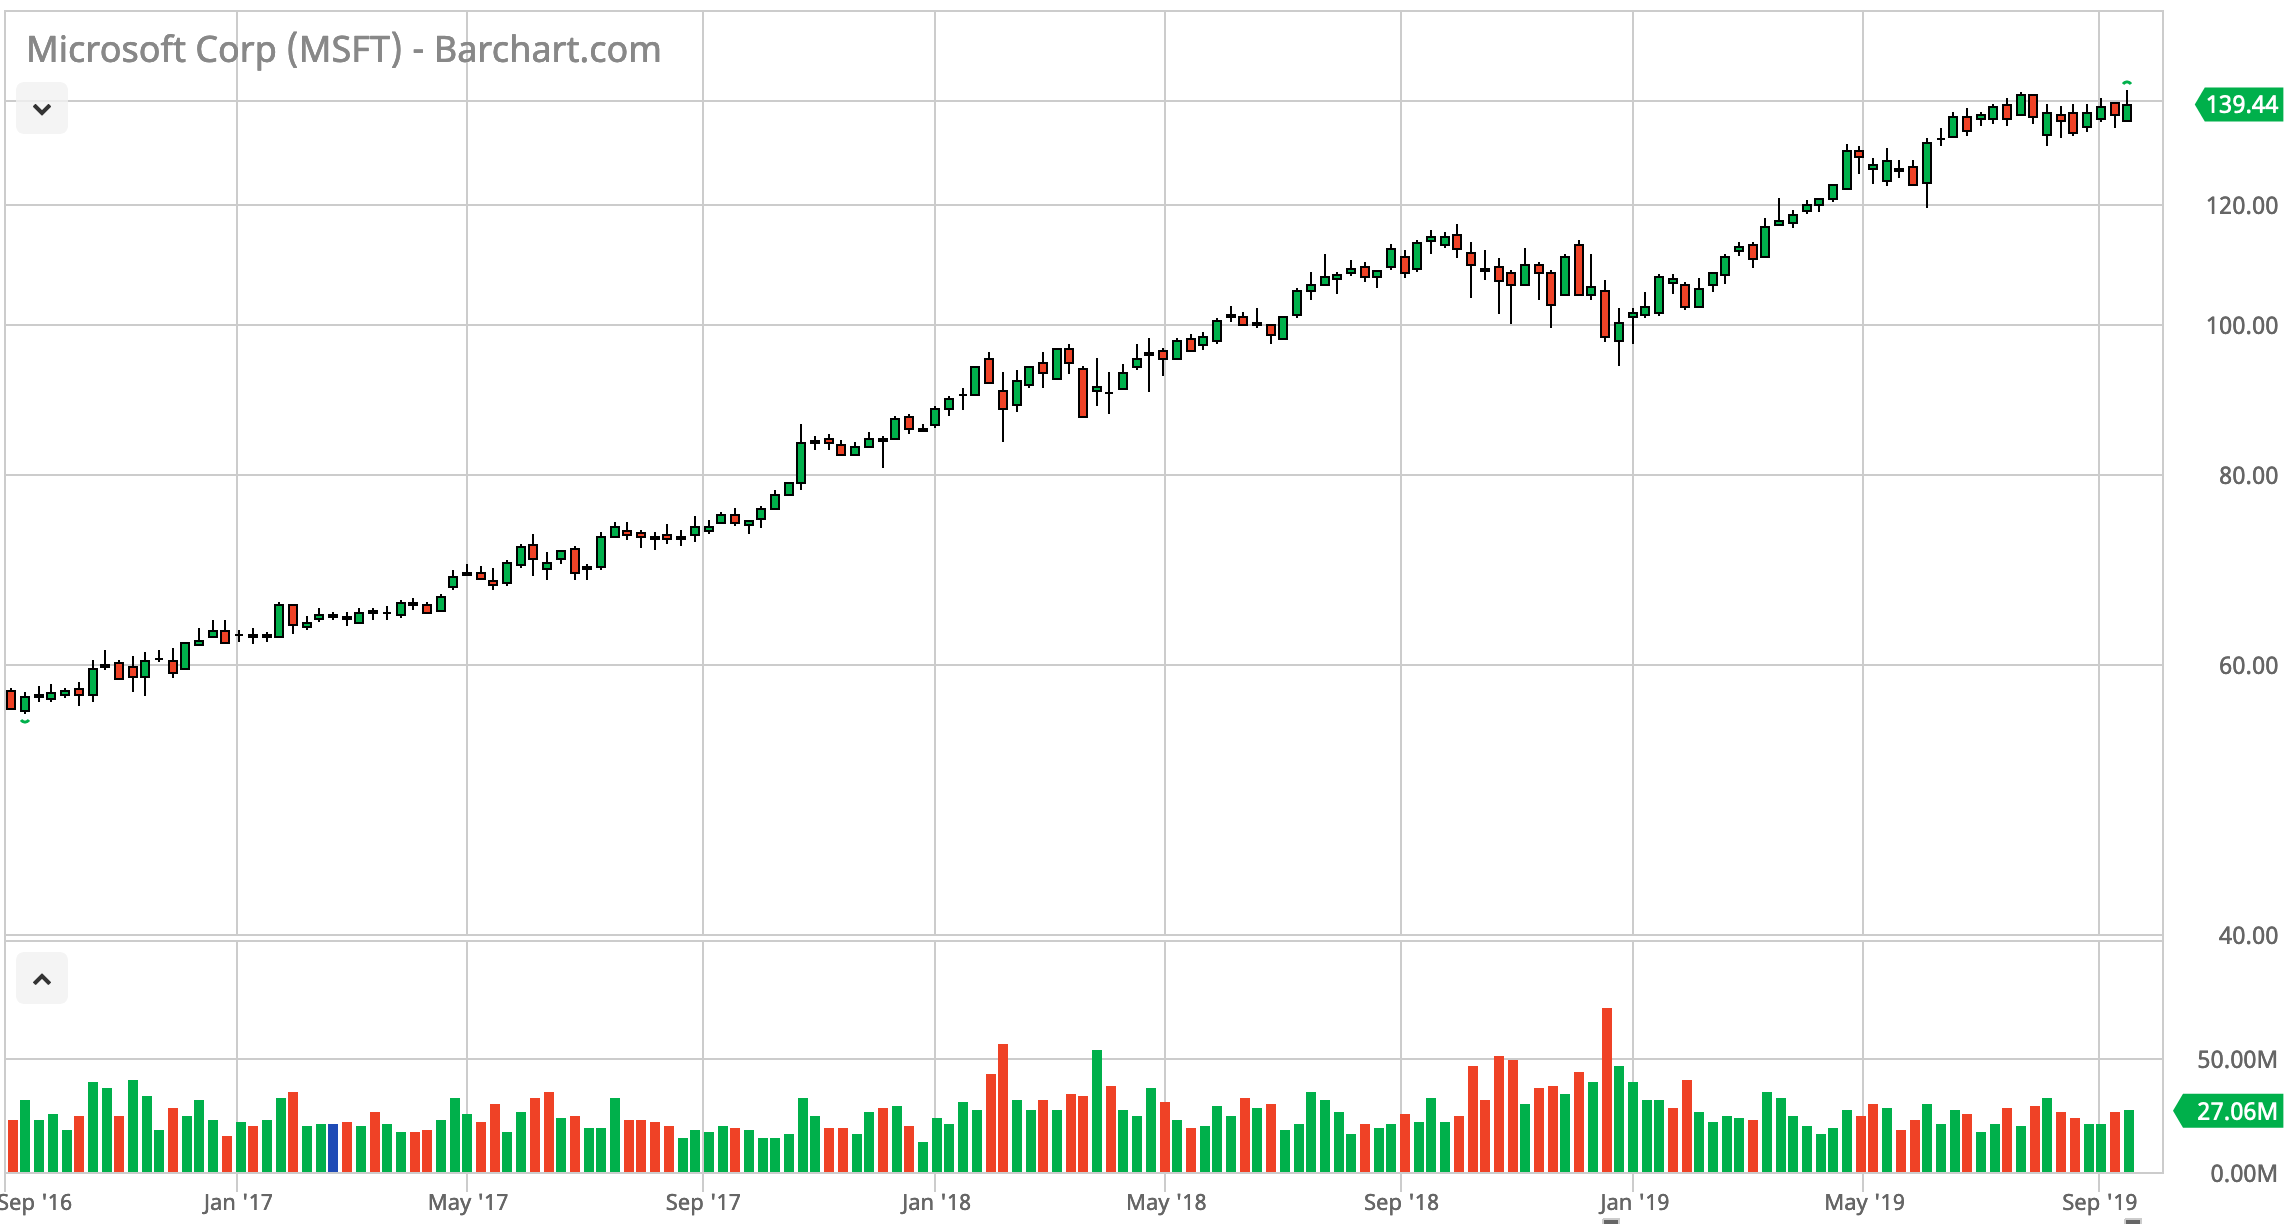
Candlestick Chart - used in Japan to trade rice futures but brought to Western traders in 1991 by Steve Nison
- similar to bar charts as it has the high, the low, opening and closing prices
- a box is used to represent the opening and closing prices this is known as the real body
- if security closed at a higher price than it opened the real body is white (green)
- if security closed at a lower price than it opened the real body is black (red)
- shadows (wicks) are the thin vertical bars on the top and bottom that represent the extremes of trading session
- upper shadow is above the real body
- lower shadow is below the real body
-
What Type of Scale Should be Used
- Arithmetic Scale
- price using vertically will be evenly spaced ex: 1,2,3 (single increment) or 0,5,10(fives)
- Semi-Logarithmic Scale
- good to use for observing long term price movements (2+ years)
- vertical distance represents the same percentage change in price
- trend lines will be different than on arithmetic scale